Powered by SpectrumCore
Transforming unstructured reviews into precise, actionable insights.
Teaching Style Spectrum
2D projection. Cluster centroids. Five teaching archetypes.
Legend
K-means k=10 · Silhouette 0.12 (low)
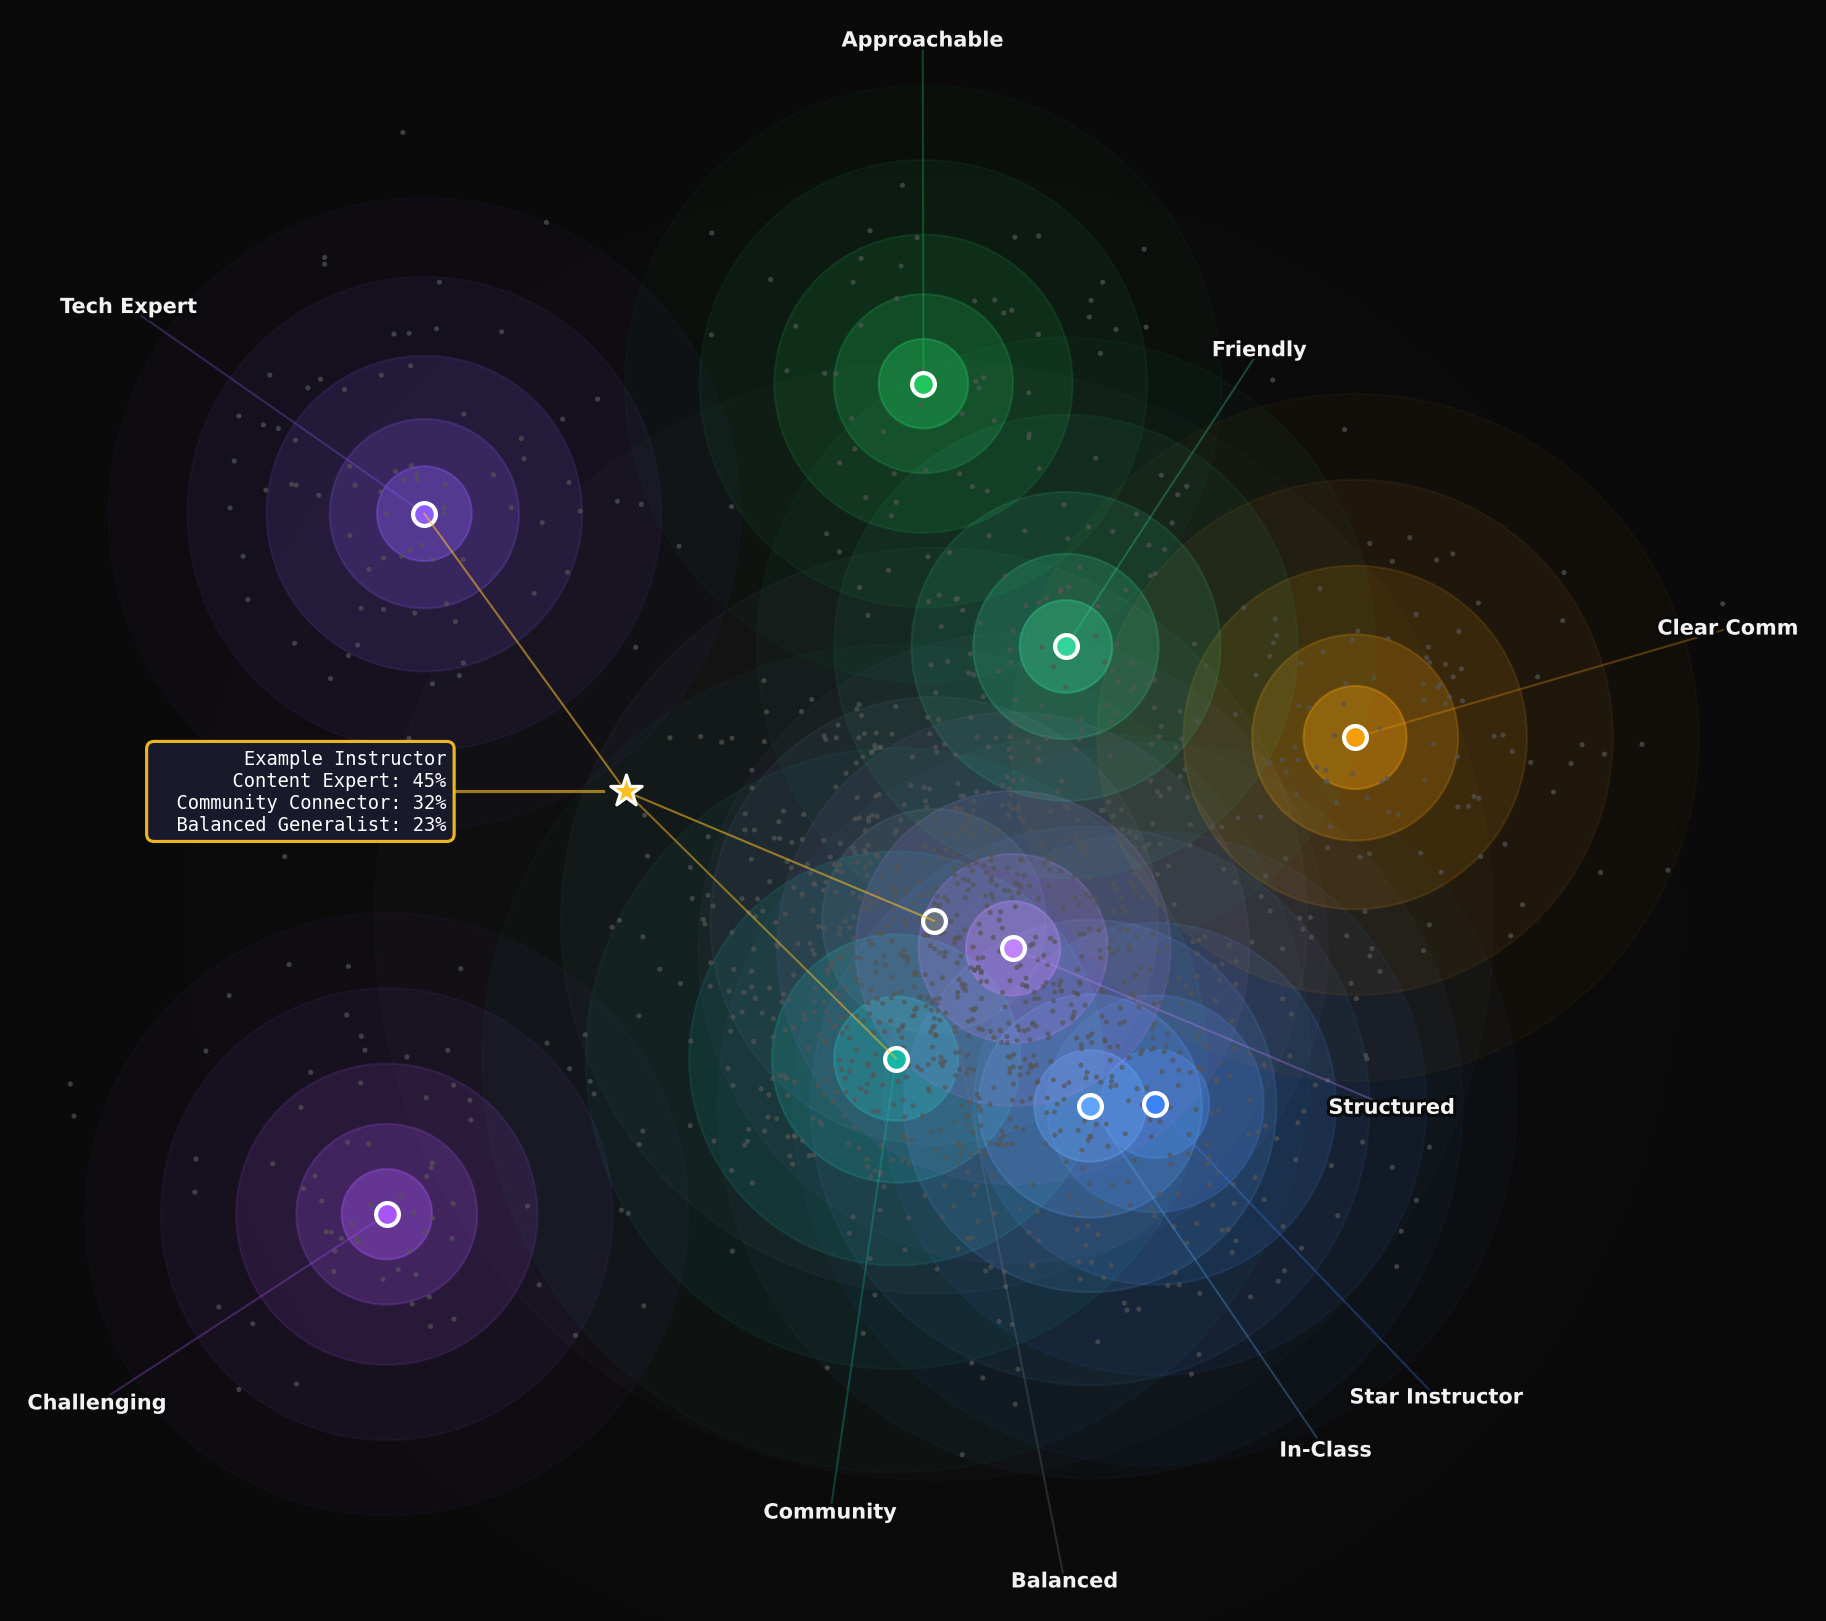
Instructors sit on a continuous spectrum of teaching styles, not in fixed categories. Each dot is one instructor; the colored halos are centroids—typical profiles from clustering 16 rating dimensions. Distance to a centroid shows affinity to that profile; we then group these 10 profiles into five archetypes for the radar view.
From Ratings to Patterns
16 dimensions. Anomaly detection. Pattern correlation.
Strong learning outcomes correlate with students feeling time was well spent
Difficulty translates to skill development — challenging but rewarding
Unclear teaching causes poor learning outcomes — systemic issue for instructors
92 rules mined → 39 significant (p<0.01) → 31 filtered → 8 for students, 17 for instructors
The Pipeline Architecture
From raw evaluations to actionable insights through a multi-stage verification pipeline. Each layer builds on verified data—analysis and writing are deliberately separated.
Statistical Pattern Detection
Pure mathematics extracts signals from evaluation data. The system analyzes ratings across 16 dimensions, comparing against course, department, and university baselines to identify meaningful patterns—no AI interpretation yet.
Anomaly Detection
Flags dimensions with significant deviations from baselines. Identifies exceptional strengths and critical gaps in the data.
Spectrum Positioning
Maps instructors across teaching profiles using statistical clustering. Determines if the pattern is clear, dual-dominant, or mixed.
Overflow Detection
Identifies when ratings break expected boundaries—excellence zones, extreme deltas, or concerning disconnects between dimensions.
Coupling Rules
Detects correlated patterns across dimensions using pre-validated rules. Example: high clarity often pairs with high overall satisfaction.
Evidence Extraction
The first AI layer enters—but its job is extraction, not interpretation. Guided by statistical signals from Stage 1, the Evidence Miner reads through student comments to find concrete examples that support or explain detected patterns.
Targeted Extraction
Instead of processing all comments blindly, the system searches for evidence related to specific signals: overflow patterns, coupling triggers, controversial dimensions.
"The assignments were challenging, but Professor always took time to explain concepts thoroughly during office hours..."
Narrative Generation
Now AI can write—but only based on verified evidence. Three specialized models transform spectrum positions and extracted evidence into actionable narratives for students and instructors.
Student Summary Writer
Personalized fit assessment
Creates "Suits You If" and "Think Twice If" sections based on spectrum profile and evidence patterns. Helps students determine course fit.
Suits You If: You thrive with clear structure and appreciate detailed feedback...
Think Twice If: You prefer exploratory learning with minimal guidance...
Instructor Report Writer
Actionable improvement insights
Translates statistical patterns and evidence into concrete teaching insights. Highlights strengths to maintain and specific improvement opportunities.
Facet Detail Writer
Deep dives into key aspects
Expands on three critical facets with evidence-backed details: Teaching Design, Assessment & Workload, Learning Experience.
This separation prevents AI hallucination: patterns are mathematically detected, evidence is carefully extracted, and only then can synthesis create narratives.
Built for Students
SpectrumCore transforms messy evaluation data into actionable insights.
Evidence-anchored course intelligence. No hallucinations.